Research, Live Pricing And Decision Tools In One Connected Workspace
Research libraries, live pricing, decision tools and Inrity, Claight’s AI assistant, behind one sign-in.
One search across the world's industries
Search industries, suppliers, prices, cost models and market risk across 60 countries, all from one box on hub.claight.com.
Searching opens hub.claight.com, where you can sign up or sign in to see full results.
Commercially reusable public data, combined with Claight research.
20 procurement and market-intelligence capabilities behind a single sign-in
Most features require signing in. Every feature is one click away in the left-hand navigation.
- 01What it is
- 02How it is organised
- 03How it works together
- 04Who it serves
What it is
A procurement and market-intelligence platform at hub.claight.com that combines research libraries, interactive tools, editorial insight and a built-in AI assistant in one workspace.
How it is organised
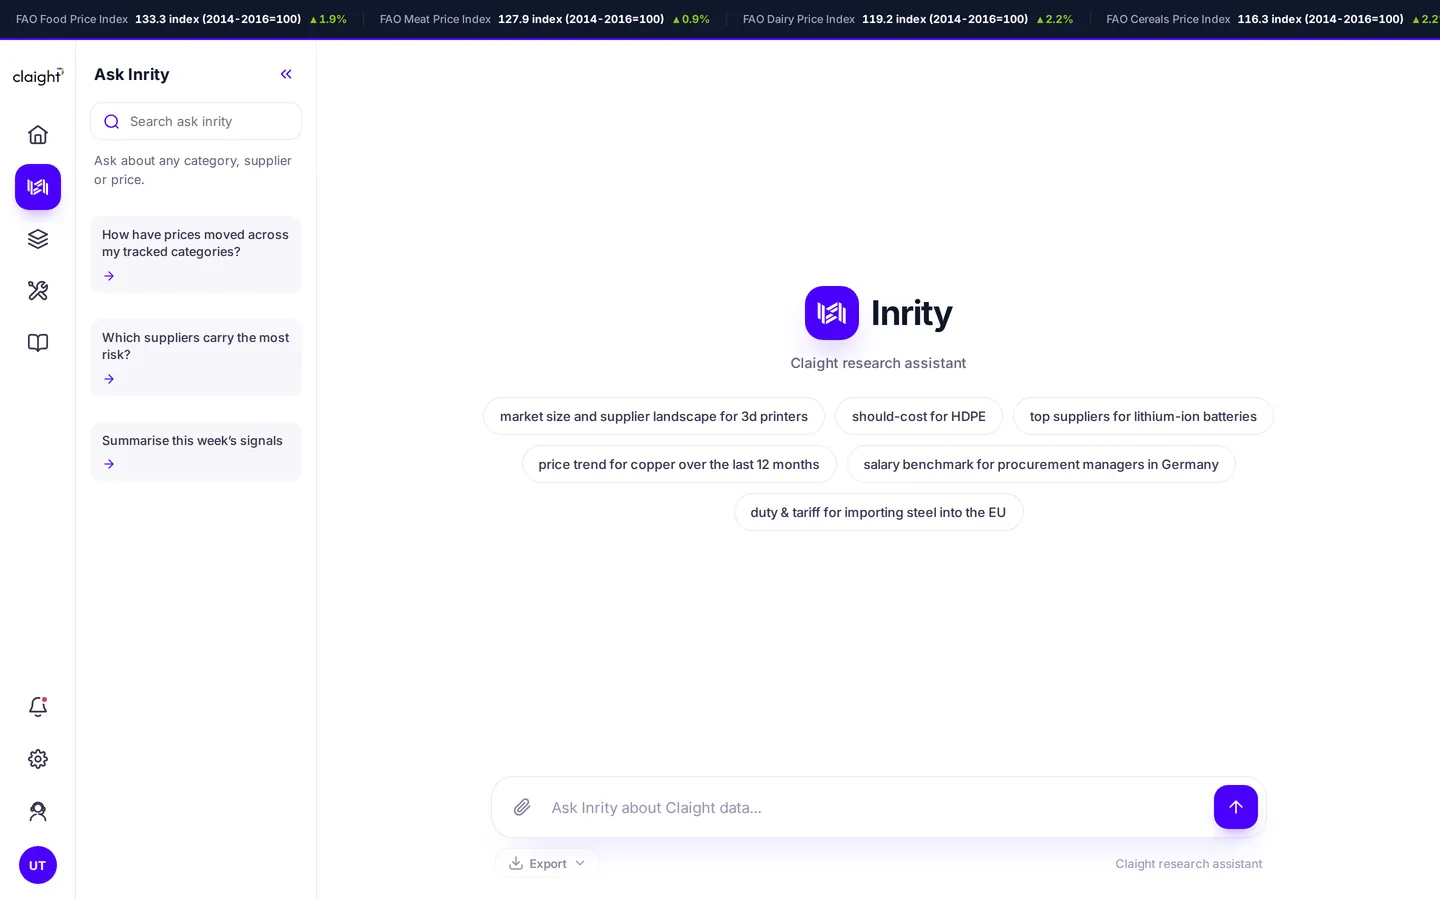
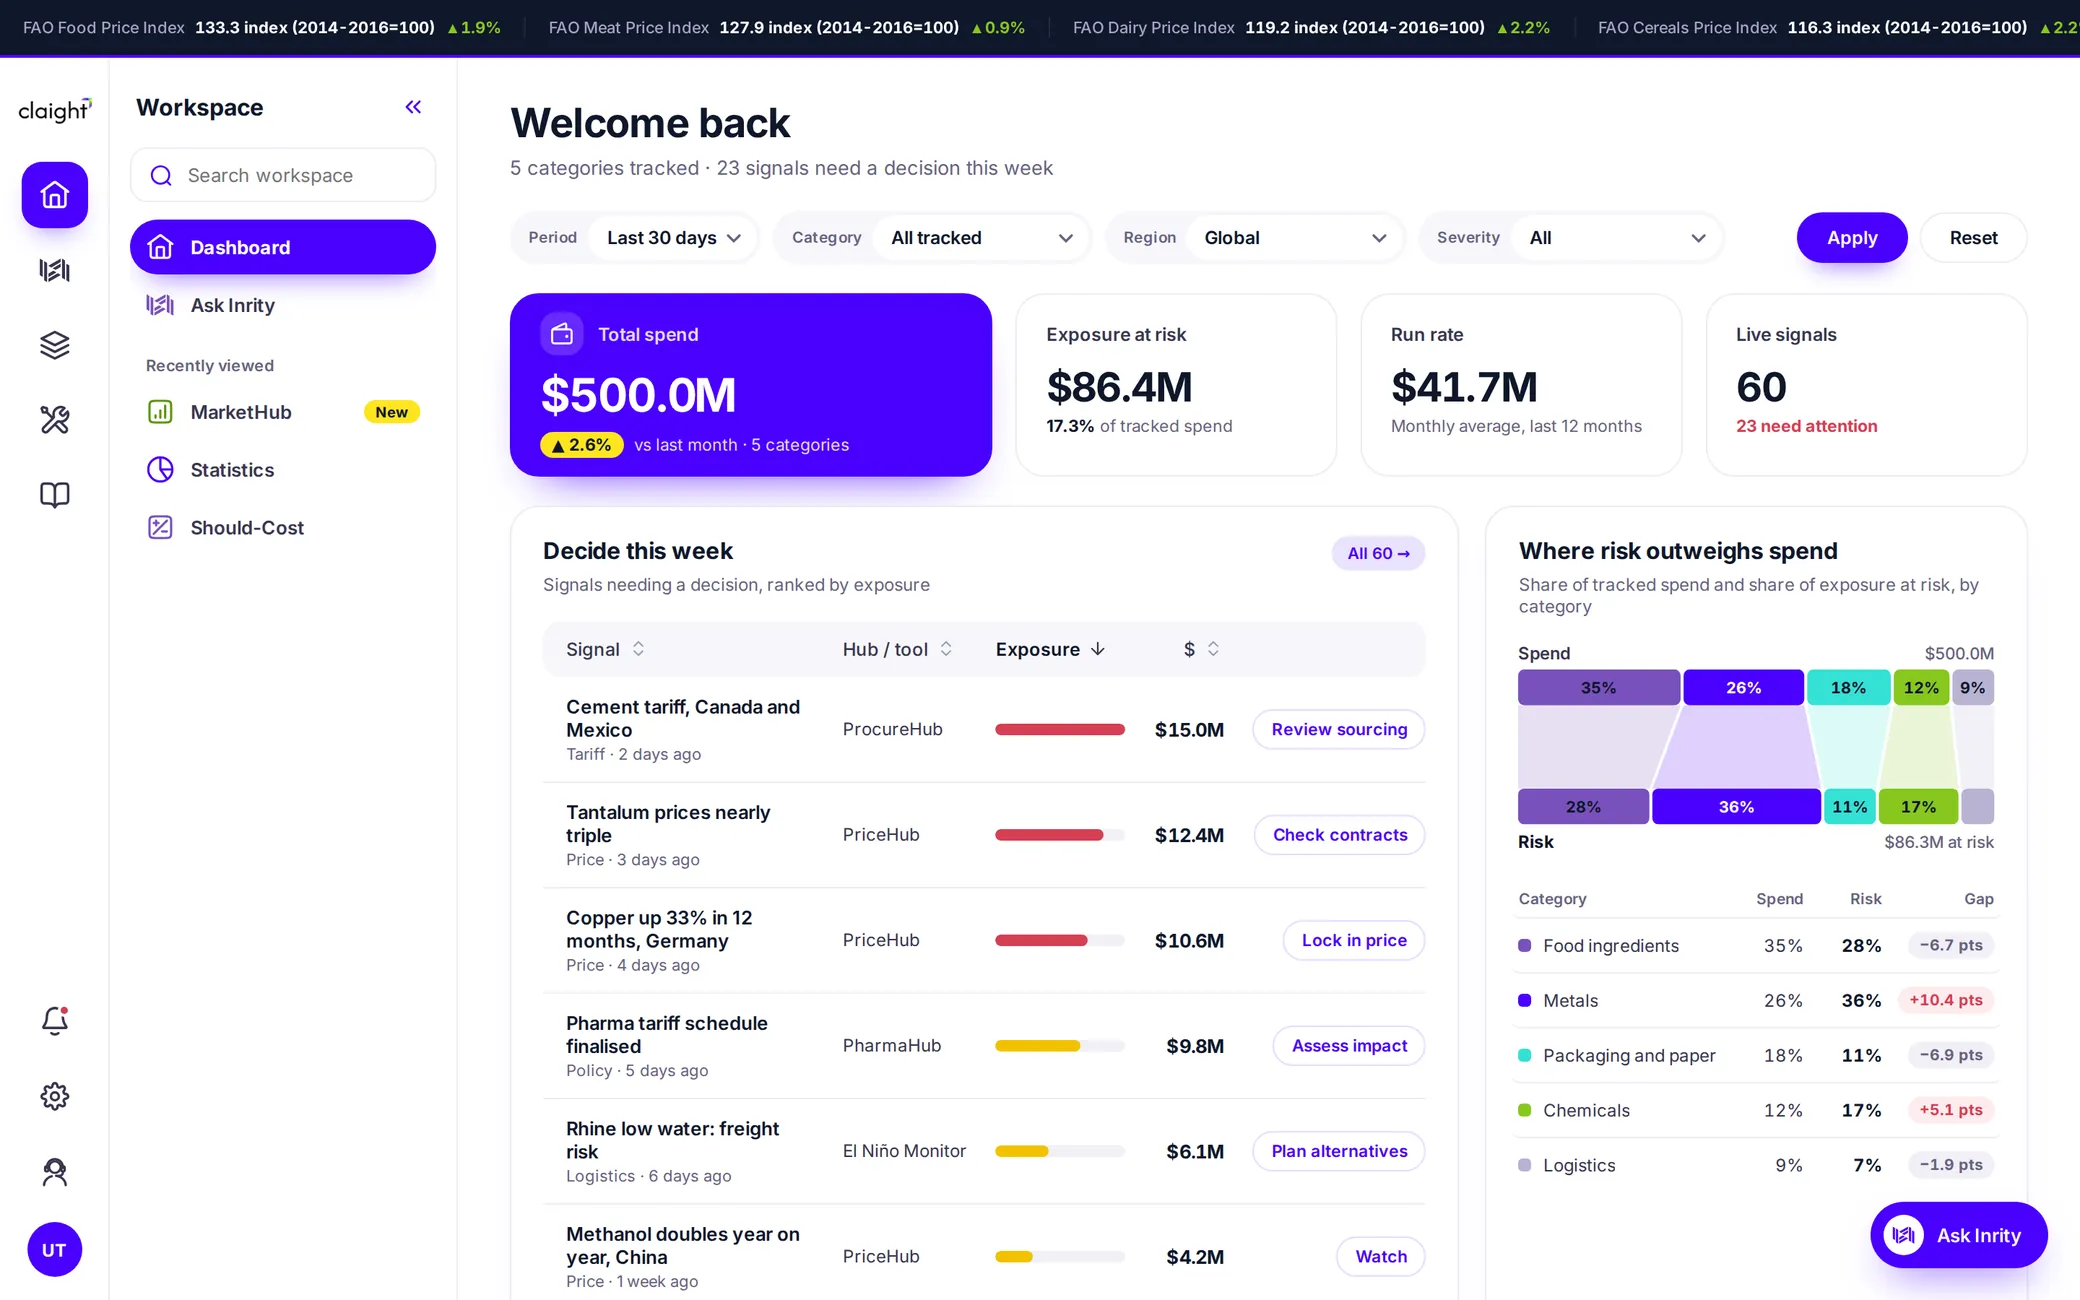
Four sections in the left-hand navigation: 9 Hubs to browse and read, 8 Tools to act with, Insights for Claight’s own point of view, and the Essentials, a personalised Dashboard and Ask Inrity.
How it works together
Statistics and PriceHub power the live price ticker and in-report charts; Monitor feeds decision signals to the Dashboard; Inrity answers questions from Claight’s market, price, supplier and category data.
Who it serves
Category managers preparing sourcing strategies, buyers challenging supplier quotes with defensible cost models, and teams planning budgets, hiring and responses to supply risk.
Scanning the web 24/7 and turning 1M+ data points into real-time signals
Hubs are libraries you browse and read. Tools are utilities you act with, such as calculators, monitors and workflows. Insights is Claight's own commentary.
Thought leadership
Editorial insight that complements the data and reports in the hubs./thought-leadershipClaight’s articles, commentary and points of view on procurement and market trends.
- 01. DataFigures, series, forecasts and live prices
- 02. ResearchStructured analysis of markets, categories and suppliers
- 03. Point of viewWhat it means and what to do about it
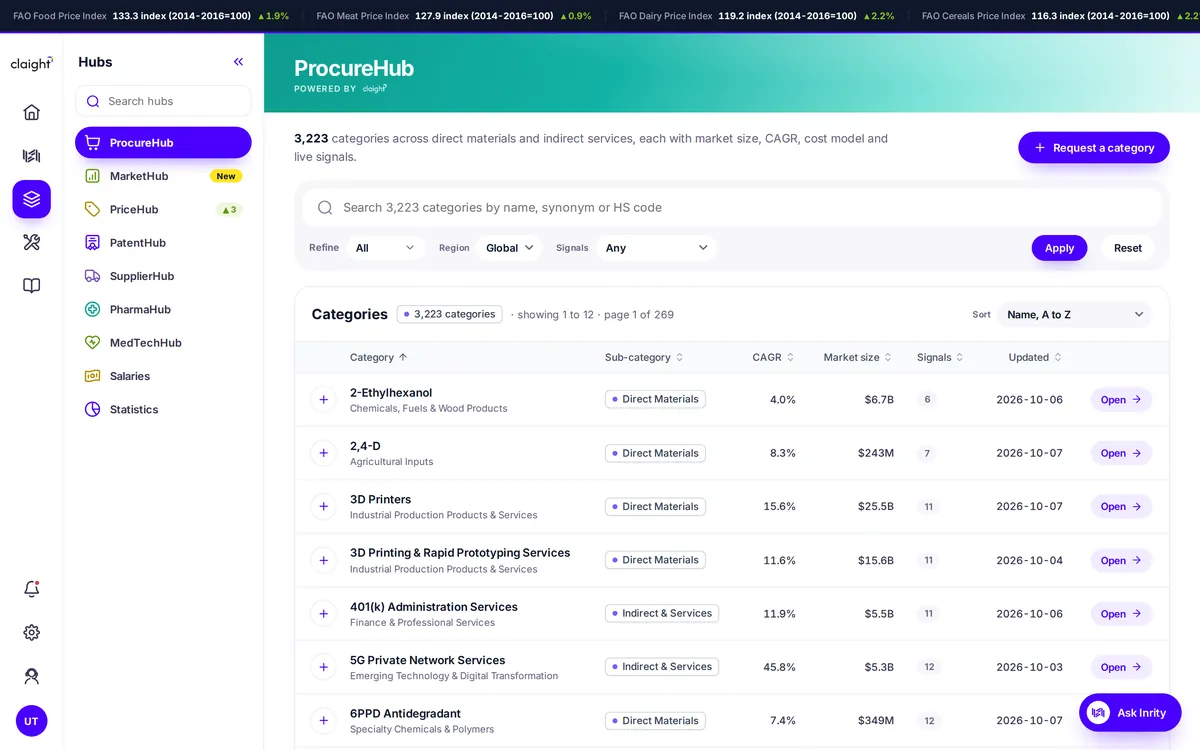
ProcureHub
Direct and indirect spendDeep category reports that form the hub's core procurement-intelligence library.
What’s inside
MarketHub
Size, forecasts, competitionFlagship market-research reports in the classic ‘market report’ format.
What’s inside
PriceHub
Live commodity and input pricesCommodity, raw-material and input prices with historical trends.
What’s inside
PatentHub
Patent activity and technology ownershipExplores patent filings and technology ownership in a field: who is innovating, where activity is concentrated, and which organisations hold the intellectual property.
Used for
SupplierHub
Supplier discovery and company recordsA supplier directory with structured company records. Discover and compare potential suppliers and review company profiles.
Used for
PharmaHub
Pharma and healthcare market researchMarket intelligence focused on pharmaceuticals, biotech and healthcare.
What’s inside
MedTechHub
Medical device and diagnostics researchMarket intelligence for medical devices, diagnostics and related categories. The counterpart to PharmaHub.
What’s inside
Salaries
Compensation benchmarks by role and regionCompensation and salary benchmarks across roles and geographies, so you can gauge market pay rates.
Used for
Statistics
Figures and forecasts behind every hubA large library of statistics pages, each presenting figures and forecasts for a specific topic. Series span eight domains, and power the live price ticker and the charts inside reports.
Domains
Should-Cost
Model a part cost from the ground up/cost-calculatorBuilds a part or product cost line by line, so buyers can challenge supplier quotes with a defensible model rather than gut feel.
Inflation Monitor
Your basket’s inflation vs headline CPI/inflation-monitorBuilds a cost index from your own basket of categories and compares it with official inflation (CPI / PPI).
Duty and Tariff
Landed cost, duties and trade flows/trade-dataShows the true delivered cost of sourcing from a given country, and how trade is flowing.
- Import-duty rates
- Tariff schedules
- Landed-cost estimation
- Trade flows and partner-country data by product heading
El Niño Monitor
Weather-driven commodity risk/el-nino-monitorTracks El Niño and weather-driven disruption to commodities and logistics, so you can see how weather is pressuring supply and freight.
- Curated price catalogue
- Live waterway gauges (e.g. the Rhine)
- Downloadable editions
Monitor
Signals and alerts on your categories/signalsTurns the hub's data into a running watchlist of things to act on.
Sustainability
ESG / Sustainability Compass/sustainability · ESG / Sustainability CompassAn assessment tool for evaluating sustainability and ESG performance.
DocuHub
Send and sign documents/documents · Send and sign documentsA document workflow for sending and electronically signing documents from within the hub.
Request intel
Commission bespoke research/requests/new · Commission bespoke researchWhen no off-the-shelf report covers what you need, Claight's analysts research it for you.
- Spot the gapNo off-the-shelf report covers what you need
- CommissionSubmit a bespoke research request
- Analysts researchClaight's analysts take on the request
- TrackFollow status under "My requests"
Industry coverage by sector, ready to browse
The largest sectors on Claight Hub, with the number of industries covered in each. All sectors
 Manufacturing986 industriesBrowse
 Consumer Goods & Services716 industriesBrowse
 Advisory & Financial Services326 industriesBrowse
 Technology291 industriesBrowse
 Life Sciences283 industriesBrowse
 Wholesale Trade216 industriesBrowse
 Industrial Machinery, Gas & Chemicals210 industriesBrowse
 Retail Trade197 industriesBrowse
Cotton fibre: projected to grow 3.4% a year to $65.0B by 2032
A sample of the industry snapshots on Claight Hub, bringing market size, buyer power, trade flows and production together in one view. View cotton fibre report
3.4% CAGR, base case. About $13.4B of growth over seven years, driven by price rather than volume.
Supplier-favoured, on a scale from -5 to +5.
43.8M bales traded. China is the largest single importer, and Asia takes about 75% of cross-border flow.
480-lb bales for 2025/26, per USDA data.
| Year | Market value | USD | vs 2025 |
|---|---|---|---|
| 2025 base | $51.6B | — | |
| 2026 forecast | $53.4B | +3.5% | |
| 2027 forecast | $55.2B | +7.0% | |
| 2028 forecast | $57.0B | +10.5% | |
| 2029 forecast | $59.0B | +14.3% | |
| 2030 forecast | $61.0B | +18.2% | |
| 2031 forecast | $63.1B | +22.3% | |
| 2032 forecast | $65.0B | +26.0% |
- 3D PrintersProcureHub · Industrial Production Products & ServicesRead report
- 5G Private Network ServicesProcureHub · Emerging Technology & Digital TransformationRead report
- Lithium-Ion BatteriesProcureHub · Industrial Production Products & ServicesRead report
- Carbon BlackProcureHub · Specialty Chemicals & PolymersRead report
- Solar Panel InstallationProcureHub · Facility Maintenance Products & ServicesRead report
- Data Center ServicesProcureHub · Engineering, Research & Technical ServicesRead report
Thought leadership adds Claight's own point of view
Editorial insight that complements the data and reports in the hubs.
Thought leadership
/thought-leadershipClaight's articles, commentary and points of view on procurement and market trends.
Articles · Commentary · Points of view16 solutions live on Claight Hub today
Every Hub and Tool on hub.claight.com, from category benchmarks and should-cost models to climate risk signals.
 Get started
Explore Claight Hub
Sign in to access every Hub, Tool and Insight, and ask Inrity anything about your categories, prices and suppliers.