
HomeTools
Procurement digital tools

Seven Digital Tools, Each Built For One Procurement Job

Seven separate tools built on Claight’s research. Each one does a single job well, from knowing what a product should cost to tracking sustainability. Start with the one you need and add others when you are ready.

Digital Should Cost Model
Models / Caustic Soda / v3Share
Caustic SodaMembrane cellIndiaModel v3
Should cost$412/tBottom up, 200 kt/yr plant
Supplier quote$468/tReceived 2 Oct
Room to negotiate$56/t12% above should cost
Cost build-upUSD per tonne
Raw materialsUtilitiesLabourOverheadsDepreciationMargin
Component$/tShare
Raw materials15738%
Utilities14034%
Labour256%
Overheads379%
Pricing Dashboard
Search 1,000+ productsLive
Rice 198.97 ▼ -2.4%Wheat 220.28 ▼ -1.5%Cassava 90.50 ▼ -13.1%Corn 327.94 ▲ +6.7%Yellow Phosphorus 3,437.90 ▲ +17.2%Acetic Acid 451.53 ▲ +30.7%Phenol 1,127.35 ▲ +11.8%Methanol 319.58 ▲ +9.8%Toluene 783.94 ▲ +5.0%Butter 4,215.00 ▼ -19.1%Refined Sugar 587.62 ▼ -11.3%Coffee 6,814.79 ▼ -2.2%Rice 198.97 ▼ -2.4%Wheat 220.28 ▼ -1.5%Cassava 90.50 ▼ -13.1%Corn 327.94 ▲ +6.7%Yellow Phosphorus 3,437.90 ▲ +17.2%Acetic Acid 451.53 ▲ +30.7%Phenol 1,127.35 ▲ +11.8%Methanol 319.58 ▲ +9.8%Toluene 783.94 ▲ +5.0%Butter 4,215.00 ▼ -19.1%Refined Sugar 587.62 ▼ -11.3%Coffee 6,814.79 ▼ -2.2%
AllAgricultureChemicalsFoodPolymersEnergy
CommodityLatest price6M changePeriod
RiceSpot FD, Brazil · USD/MT198.97▼ -2.4%Jan-26
WheatSpot FD, Brazil · USD/MT220.28▼ -1.5%Jan-26
CassavaSpot FD, Brazil · USD/MT90.50▼ -13.1%Jan-26
CornSpot FD, China · USD/MT327.94▲ +6.7%Feb-26
Yellow PhosphorusSpot FD, China · USD/MT3,437.90▲ +17.2%Feb-26
Acetic AcidFOB, India · USD/MT451.53▲ +30.7%Feb-26
PhenolFOB, 99.99% Min, USA · USD/MT1,127.35▲ +11.8%Dec-25
MethanolSpot FD, China · USD/MT319.58▲ +9.8%Feb-26
Verified Prices checked by analystsShowing 8 of 22
Procure 360
HS code, product or company
Betaines (CAPB) · Philippines imports · 2021 to 2024Search
Your share of imports45%Nearly double the nearest competitor
Standard grade30% AM65% of imports
Packaging shiftDrumsFlexibags to 200 kg drums
Import volume by originMT, 2021 to 2024
Indonesia
Malaysia
China
Germany
Thailand
Others
Sourcing Compass
Shanghai to HamburgNew scenario
OriginChina, ShanghaiDestinationGermany, Hamburg
Supplier quote basis
EXWFOBCIF
From price to landed costUSD per tonne
Supplier price1,000
Inland to port28
Origin port handling12
Sea freight64
Insurance4
Destination port handling15
Import duty 6.5%70
Inland to plant22
Landed cost, DDP1,215
Spend Analytics
Period: last 12 monthsBusiness unit: All
ProcurementFinanceStrategy
Total spend$248.6MLast 12 months
Spend visibility95%Captured and categorised
Under contract78%+6 pts this year
Suppliers1,240Across 14 countries
Spend by category
$248.6M12 months
Raw materials38%Packaging22%Logistics16%Services14%Other10%
Spend by regionUSD M
Europe96
Asia71
North America54
Latin America28
7standalone digital tools
1,000+products priced in the Pricing Dashboard
Up to 3Xsavings from Spend Analytics and Complexity Reduction
All digital tools

Seven tools, each with its own job

Every tool is a separate product. Select a screen above each one to see what it does.

1
Cost and price intelligence

Know what things should cost

Engineered cost models and live prices for the materials you buy.

Cost and price intelligence

Digital Should Cost Model

Know what a product should cost

Move beyond static spreadsheets and guesswork. See what a product should cost, how each input contributes, and where the negotiation levers sit across suppliers, processes, grades and regions.

  • Full cost breakdown
  • Historical cost progression
  • Sensitivity and scenario analysis
  • Editable simulator
Digital Should Cost Model
Models / Caustic Soda / v3Share
Caustic SodaMembrane cellIndiaModel v3
Should cost$412/tBottom up, 200 kt/yr plant
Supplier quote$468/tReceived 2 Oct
Room to negotiate$56/t12% above should cost
Cost build-upUSD per tonne
Raw materialsUtilitiesLabourOverheadsDepreciationMargin
Component$/tShare
Raw materials15738%
Utilities14034%
Labour256%
Overheads379%
12-month change+4.2%Should cost
Quote gap today12%vs 10% a year ago
Main driverPower+9% tariff in 12 months
Should cost vs supplier priceUSD/t, quarterly
Q3 2023Q3 2024Q3 2025Q3 2026
Should costSupplier price
Edit inputsRecalculates instantly
Scenario resultvs base model
Should cost$412/tBase case
Raw materials157
Utilities140
Labour25
Overheads37
Global benchmarkCaustic soda, USD/t
Saudi Arabia$371
China$386
India$412
USA$455
Germany$498
Compare routes and grades
Route$/tvs base
Membrane cell48% lye412base
Diaphragm cell50% lye439+6.6%
Membrane cellFlakes468+13.6%
Search 10 cost modelsNew model
Model repositoryVersion controlled
ModelVersionUpdatedStatus
AmmoniaHaber-Bosch, natural gasv45 OctApproved
Caustic SodaMembrane cellv35 OctApproved
Soda AshSolvay processv228 SepIn review
Sodium SulphateMannheim processv221 SepApproved
Phosphoric AcidWet processv114 SepDraft
Cost and price intelligence

Pricing Dashboard

Live prices for 1,000+ products

Your partner for live raw material prices, market analysis and sourcing decisions. Region-specific prices for more than 1,000 products across 9+ industries, built for procurement teams.

  • Live, verified prices
  • Maximise profitability in dynamic markets
  • Sharp, strategic insights
  • Mitigate risks and protect margins
Pricing Dashboard
Search 1,000+ productsLive
Rice 198.97 ▼ -2.4%Wheat 220.28 ▼ -1.5%Cassava 90.50 ▼ -13.1%Corn 327.94 ▲ +6.7%Yellow Phosphorus 3,437.90 ▲ +17.2%Acetic Acid 451.53 ▲ +30.7%Phenol 1,127.35 ▲ +11.8%Methanol 319.58 ▲ +9.8%Toluene 783.94 ▲ +5.0%Butter 4,215.00 ▼ -19.1%Refined Sugar 587.62 ▼ -11.3%Coffee 6,814.79 ▼ -2.2%Rice 198.97 ▼ -2.4%Wheat 220.28 ▼ -1.5%Cassava 90.50 ▼ -13.1%Corn 327.94 ▲ +6.7%Yellow Phosphorus 3,437.90 ▲ +17.2%Acetic Acid 451.53 ▲ +30.7%Phenol 1,127.35 ▲ +11.8%Methanol 319.58 ▲ +9.8%Toluene 783.94 ▲ +5.0%Butter 4,215.00 ▼ -19.1%Refined Sugar 587.62 ▼ -11.3%Coffee 6,814.79 ▼ -2.2%
AllAgricultureChemicalsFoodPolymersEnergy
CommodityLatest price6M changePeriod
RiceSpot FD, Brazil · USD/MT198.97▼ -2.4%Jan-26
WheatSpot FD, Brazil · USD/MT220.28▼ -1.5%Jan-26
CassavaSpot FD, Brazil · USD/MT90.50▼ -13.1%Jan-26
CornSpot FD, China · USD/MT327.94▲ +6.7%Feb-26
Yellow PhosphorusSpot FD, China · USD/MT3,437.90▲ +17.2%Feb-26
Acetic AcidFOB, India · USD/MT451.53▲ +30.7%Feb-26
PhenolFOB, 99.99% Min, USA · USD/MT1,127.35▲ +11.8%Dec-25
MethanolSpot FD, China · USD/MT319.58▲ +9.8%Feb-26
Verified Prices checked by analystsShowing 8 of 22
RiceHS 100630FOB, USD/MTAugust 2026
Highest FOB$423.49China
Lowest FOB$242.99USA
Biggest move+14.6%Brazil, vs July
FOB price by regionJuly vs August 2026
Vietnam393.57▼ -0.6%
China423.490.0%
India398.76▼ -3.0%
Brazil287.79▲ +14.6%
USA242.99▼ -0.9%
JulyAugust
Latest developmentRice · Aug 2026

US rice prices rally on sharp acreage drop. US rice futures rose as 2026 long-grain acreage fell, with Arkansas planting at its lowest level in nearly 50 years.

SupplyNorth AmericaAnalyst note
Drivers this half
  • Upstream costs rose on fertiliser, fuel, freight and insurance
  • Food security buying kept downstream demand firm
  • India's ample supply capped gains
OutlookUSDA 2026/27 export projections
India25.0M MT
Vietnam8.0M MT
Thailand7.5M MT
Pakistan5.0M MT
DailyWeeklyQuarterly
USDEURINRCNY
My watchlistAlerts on 6-month moves above 15%
CommodityPriceChangeAlert
Acetic AcidFOB, India451.53▲ +30.7%Triggered
Natural GasContract FD, India11.76▼ -19.5%Triggered
Yellow PhosphorusSpot FD, China3,437.90▲ +17.2%Triggered
Polypropylene (PP)Spot, China975.62▲ +1.7%Watching
Exports to Excel and your BI toolsDownload history
2
Sourcing and trade intelligence

Source from the right place

Trade flows, suppliers and true landed costs across the world.

Sourcing and trade intelligence

Procure 360

Trade intelligence from shipment data

Country-level product analytics, supplier and buyer trends, and price and volume patterns in detail, so your sourcing and global trade decisions rest on real shipment data.

  • Customised insights
  • Material flow trends
  • Supplier landscape
  • Price benchmarking
Procure 360
HS code, product or company
Betaines (CAPB) · Philippines imports · 2021 to 2024Search
Your share of imports45%Nearly double the nearest competitor
Standard grade30% AM65% of imports
Packaging shiftDrumsFlexibags to 200 kg drums
Import volume by originMT, 2021 to 2024
Indonesia
Malaysia
China
Germany
Thailand
Others
ImportsExports
Material flowOrigin to destination port
OriginPort of loadingPort of dischargeShipmentsShare
IndonesiaJakartaManila214
MalaysiaPort KlangManila166
ChinaShanghaiBatangas128
GermanyHamburgManila72
Port-level data for logistics cost optimisation4 of 11 lanes
Supplier base expanded up to 10x with new sourcing options
Importer landscapeShare of imports, 2021 to 2024
Your company45%
Importer B23%
Importer C12%
Importer D8%
Others12%
Suppliers to evaluate
SupplierOriginGradesStatus
Supplier AIndonesia30% AMIncumbent
Supplier BMalaysia30%, 35% AMNew option
Supplier CChina30% AMNew option
Unit price benchmarkUSD/kg, landed
2021202220232024
Your priceMarket average
Grade mixShare of imports
65%30% AM
30% Active Matter65%Other grades35%
Sourcing and trade intelligence

Sourcing Compass

Your true landed cost in one view

Tariffs keep changing, freight prices swing and tax rules differ by country. A sourcing option that looks cheap can hide costs that raise the true landed cost. Sourcing Compass shows you the full picture.

  • EXW, FOB and CIF to DDP conversion
  • Port-specific freight and handling
  • Integrated inland logistics network
  • Tariff and duty visibility
Sourcing Compass
Shanghai to HamburgNew scenario
OriginChina, ShanghaiDestinationGermany, Hamburg
Supplier quote basis
EXWFOBCIF
From price to landed costUSD per tonne
Supplier price1,000
Inland to port28
Origin port handling12
Sea freight64
Insurance4
Destination port handling15
Import duty 6.5%70
Inland to plant22
Landed cost, DDP1,215
HS 3402Surfactants
Tariff matrixApplied duty, origin to destination
OriginGermanyUSAIndiaBrazil
China6.5%3.8%7.5%12.0%
India0.0%3.8%n/a12.0%
Vietnam0.0%3.8%7.5%12.0%
Turkey0.0%3.8%7.5%12.0%
USA6.5%n/a7.5%12.0%
Duties, local taxes and preferential rates includedExport to Excel
Compare originsLanded cost to Hamburg, USD/t, DDP
OriginQuoteFreight and portDutyLanded
IndiaMundra1,0359601,153
VietnamHo Chi Minh City1,01011801,150Lowest
ChinaShanghai1,000123701,215
TurkeyMersin1,1204101,183
Other chargesEditable
Documentation8
Warehousing14
Currency
USDEURINRCNY
My dashboardSaved sourcing scenarios
ScenarioLaneIncotermLandedSaved
Surfactant base, Q3CN to DEFOB1,2152 Oct
Surfactant base, Q2CN to DEFOB1,1984 Jul
Glycerine, Q3MY to DECIF94229 Sep
PET resin, Q3IN to BREXW1,30618 Sep
Market intelligenceTracked weekly
TariffsSea freightBunker fuelPort charges
3
Spend and value chain optimisation

Spend smarter and simpler

Find savings, cut complexity and track sustainability.

Spend and value chain optimisation

Spend Analytics

See where your money goes

See procurement spend across suppliers, categories, regions and business units. Analyse cost drivers, find savings, manage tail spend and improve compliance.

  • Interactive spend dashboards
  • Flexible deployment and custom views
  • Automated data integration
  • Advanced spend classification
Spend Analytics
Period: last 12 monthsBusiness unit: All
ProcurementFinanceStrategy
Total spend$248.6MLast 12 months
Spend visibility95%Captured and categorised
Under contract78%+6 pts this year
Suppliers1,240Across 14 countries
Spend by category
$248.6M12 months
Raw materials38%Packaging22%Logistics16%Services14%Other10%
Spend by regionUSD M
Europe96
Asia71
North America54
Latin America28
ERPInvoicesP2PContracts
AI spend classification12,480 lines classified this month
Raw line itemCategoryConfidence
Corrugated box 5-ply 400x300Packaging › Corrugated98%
Caustic soda 48% tankerChemicals › Alkalis97%
Diesel fleet card, FebLogistics › Fuel95%
SAP consulting daysIT services › Consulting91%
Office chairs, ergonomicFacilities › Furniture88%
Supplier and category insightsPackaging
SupplierSpendContractRisk
Supplier ACorrugated$14.2MCompliantLow
Supplier BCorrugated$9.8MCompliantLow
Supplier CCorrugated$3.1MOff contractMedium
Supplier DLabels$2.4MMaverick buyHigh
Opportunity: 6 corrugated suppliers could consolidate to 2
Tail suppliers1,0908% of spend
Maverick lines342Flagged this quarter
Tail spend control25%Reduction in unmanaged spend
Spend concentrationCumulative share of spend by supplier
Top suppliersTail
ScenarioAdjust and compare
Savings forecastAnnualised
Estimated savings$18.4M7.4% of spend
Spend and value chain optimisation

Complexity Reduction

Simplify SKUs, materials and suppliers

Find hidden inefficiencies across SKUs, packaging, raw materials and suppliers. See what drives them and what they cost, so your team can simplify operations and decide faster.

  • Interactive complexity dashboards
  • Automated data integration
  • Custom views for business units
  • Advanced complexity scoring models
Complexity Reduction
Portfolio: all SKUsUpdated today
ProcurementSupply chainR&DFinance
Active SKUs4,820
Raw materials1,135
Packaging formats312
Suppliers640
Complexity score by business unitHigher is more complex
Home care78
Personal care71
Food58
Industrial42
ERPProcurementBOM files
SKU scoringVolume, variability, margin and cost impact
SKUVolumeMarginScoreAction
Liquid detergent 450 mlPouch, lemon12k4%86Rationalise
Liquid detergent 500 mlBottle, lemon410k18%34Keep
Dish gel 750 mlBottle, lime38k7%71Review
Dish gel 740 mlBottle, lime, promo9k3%90Rationalise
Supplier and material mapOverlaps highlighted
SuppliersSupplier ASupplier BSupplier C
MaterialsLAS 96%LAS 90%SLES 70%Fragrance F-12
PackagingBottle 500 mlBottle 750 mlBottle 740 ml
ProductsDetergentDish gelDish gel promo
2 near-identical surfactant grades and 2 bottle sizes serve the same products
Low-performing SKUs-35%
Packaging formats-25%
Raw materials-20%
Cost savings10 to 12%
Before and after simplificationIndexed to 100
SKUs65
Packaging formats75
Raw materials80
TodayAfter rationalisation
Spend and value chain optimisation

Sustainability TrackerComing soon

Sustainability across your value chain

Monitor sustainability practices across suppliers, sourcing routes and manufacturing stages, so you can source responsibly and track performance over time.

  • Supplier compliance
  • Process-level indicators
  • Value chain alignment
  • Regulatory standards
Sustainability Tracker
Suppliers tracked86
On track71%
Need review19
Supplier complianceAgainst your sustainability standards
Supplier ACertified, audited 2026
On track
Supplier BCertified
On track
Supplier CCertificate expires in 30 days
Review
Supplier DNo audit on file
At risk
Process level indicatorsBy production stage
StageEnergyWaterEmissionsTrend
Raw material sourcingMediumLowHigh▼ improving
ProcessingHighHighMediumstable
PackagingLowLowMedium▼ improving
TransportMediumn/aHigh▲ rising
Value chain alignmentSourcing routes
Malaysia to Germany, palm derivativesTraceable to mill
Aligned
India to Germany, cottonTraceable to gin
Partial
Brazil to USA, sugarTraceable to mill
Aligned
China to Brazil, PET resinRecycled content not verified
Gap
Regulatory standardsEnvironmental and regulatory alignment
Supplier due diligence
On track
Packaging recycled content
Review
Deforestation-free sourcing
On track
Carbon reporting
New rule flagged
Results

What teams achieve with our tools

Figures from our tool pages and client case studies.

Up to 3XsavingsSpend Analytics and Complexity Reduction
95%spend visibilitySpend Analytics
30 to 35%sourcing efficiency gainProcure 360 client case
35%fewer low-performing SKUsComplexity Reduction client case
20%procurement efficiency gainSourcing Compass
12%potential cost savingsSpend Analytics client case
Intelligence platform

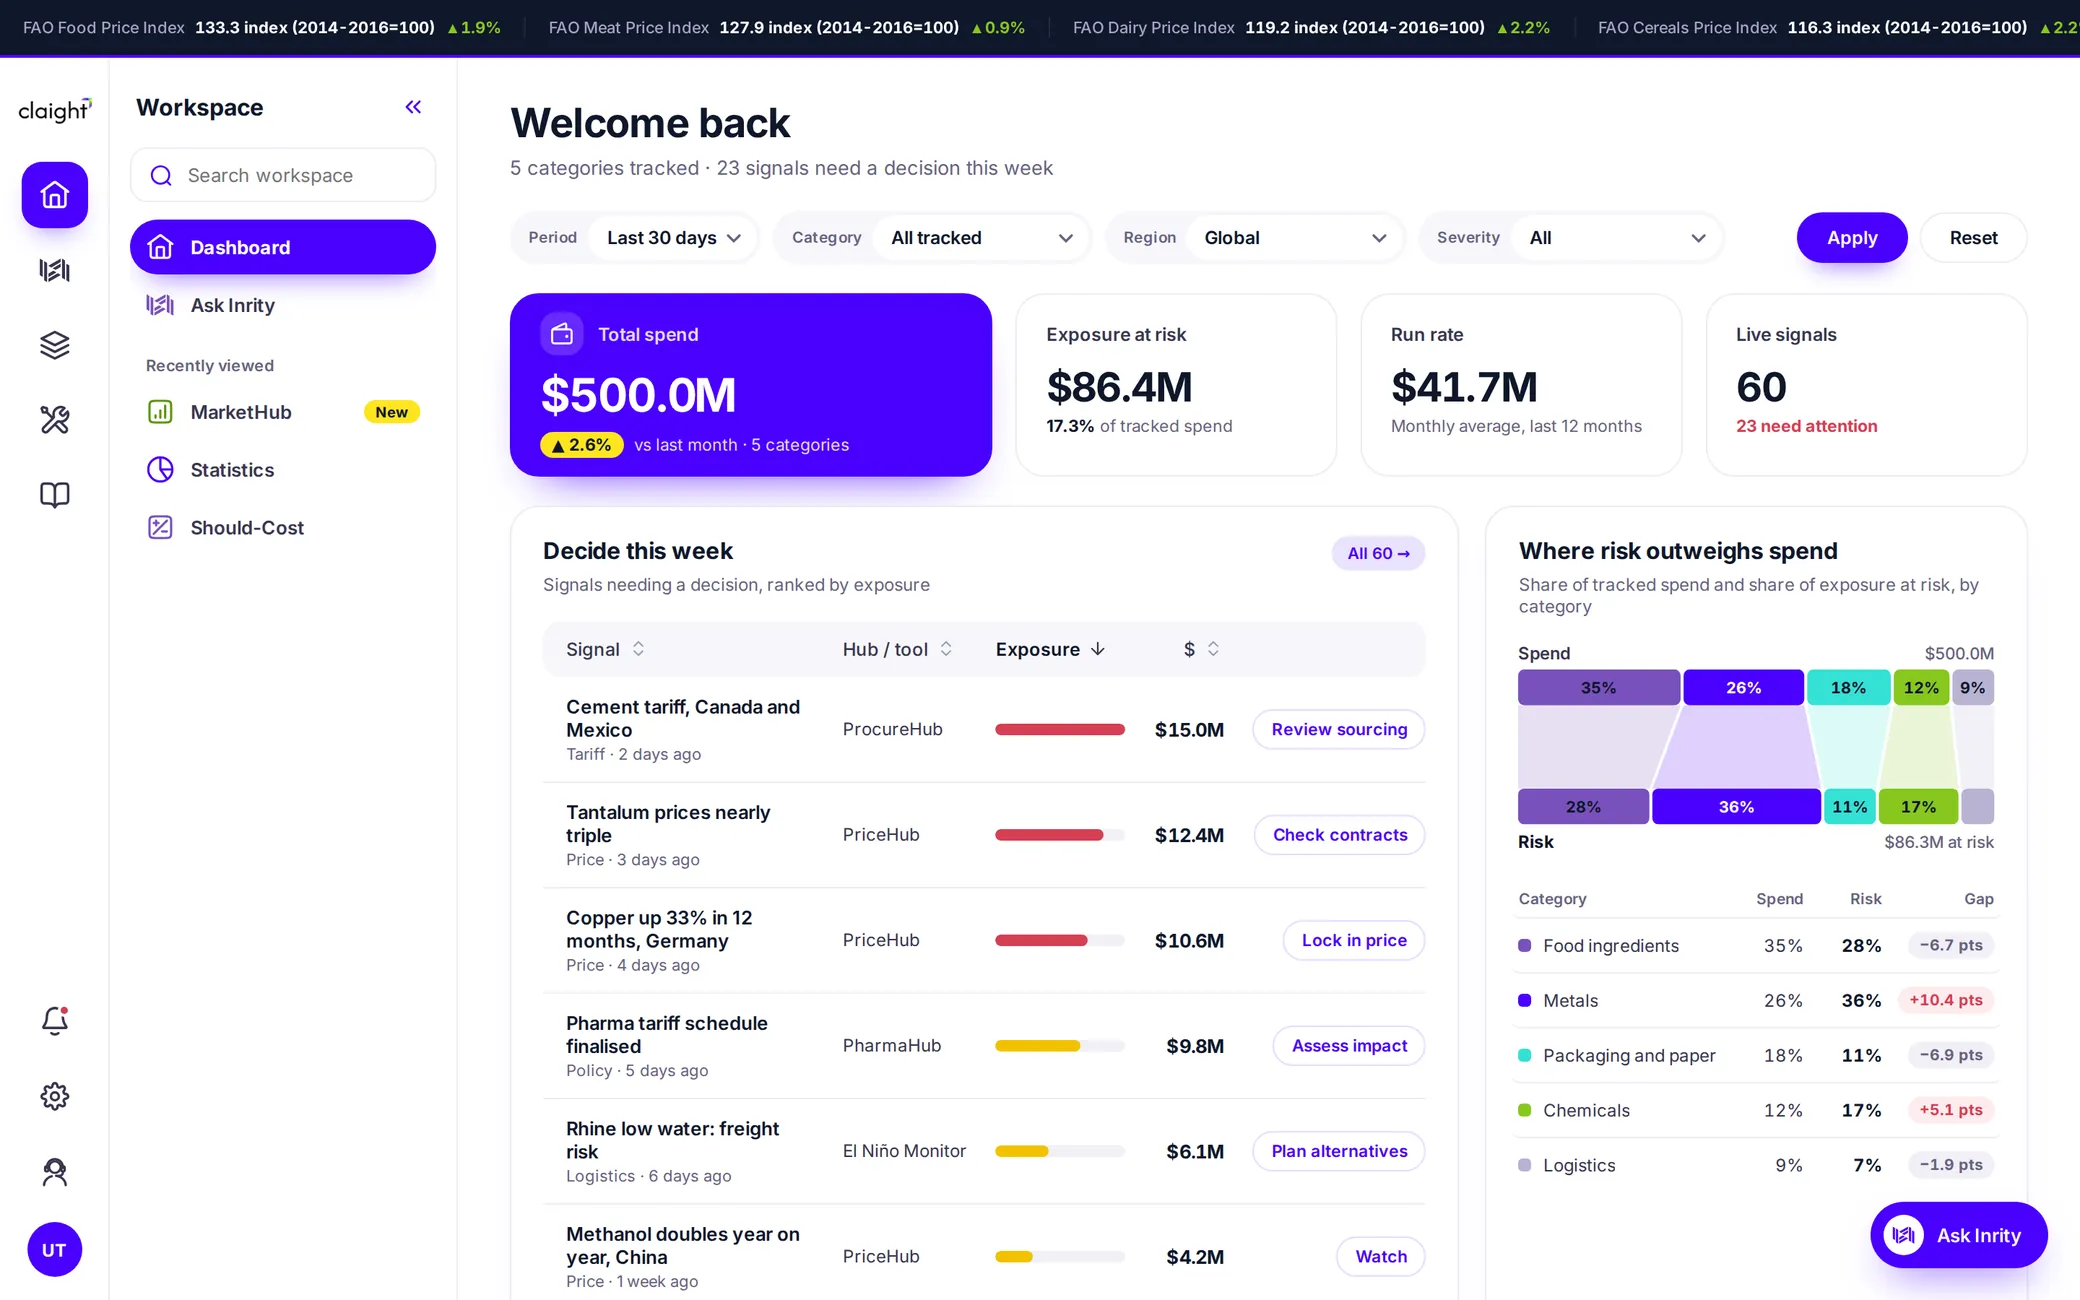
Claight Hub, a separate intelligence platform

Claight Hub brings procurement and market intelligence together in one place: industry statistics, live prices, cost models, suppliers and risk signals, searchable from one platform, with Inrity, Claight’s AI assistant, built in.

3,815industries with statistics
3,590+procurement categories
60countries covered
hub.claight.com/dashboard
The Claight Hub dashboard
Book a demo

See the tools with your own data

Tell us what you buy and what you want to achieve. A Claight specialist will set up a walkthrough around your categories, markets and goals, then reply within one working day.

1Pick the tools you are interested in
2Tell us your main goal
3We tailor the demo to your business
Tools you are interested in
Your main goal